Technical Reference for Monitoring Point Liability, Revenue, and Member Value
1. Program Health Metrics
Monthly Redemption Rate: * Metric Definition: The percentage of issued points that are successfully redeemed for rewards within the same month.
Target Benchmark: 13% – 15%. Rates below 10% indicate high churn risk and low reward appeal.
Outstanding Points Liability: * Metric Definition: The cumulative total of "Live" points currently held by your customer base. This represents your program's total financial debt.
2. Commercial & Transactional Impact
Monthly Program Revenue:
Data Logic: Derived from the Loyalty Transactions Ledger. All values are converted from cents to your local currency, and refunded transactions are automatically subtracted from the totals.
Average Order Value (AOV) Comparison:
Measures the spending delta between loyalty members and non-members to validate program ROI.
3. Membership Growth & Acquisition
Definition: Tracks the velocity of new member sign-ups and identifies the most effective acquisition channels.
Monthly Member Growth (Organic vs. Referred): This visualization segments new users by their signup source.
Technical Logic: Data is sourced from the Loyalty Members model.
Actionable Insight: Compare "Organic" vs. "Referred" growth. A rising Referred share (Dark Purple) indicates a successful viral loop—your members are acting as brand advocates. If this remains flat, consider increasing the incentive for your top-tier members to refer friends.
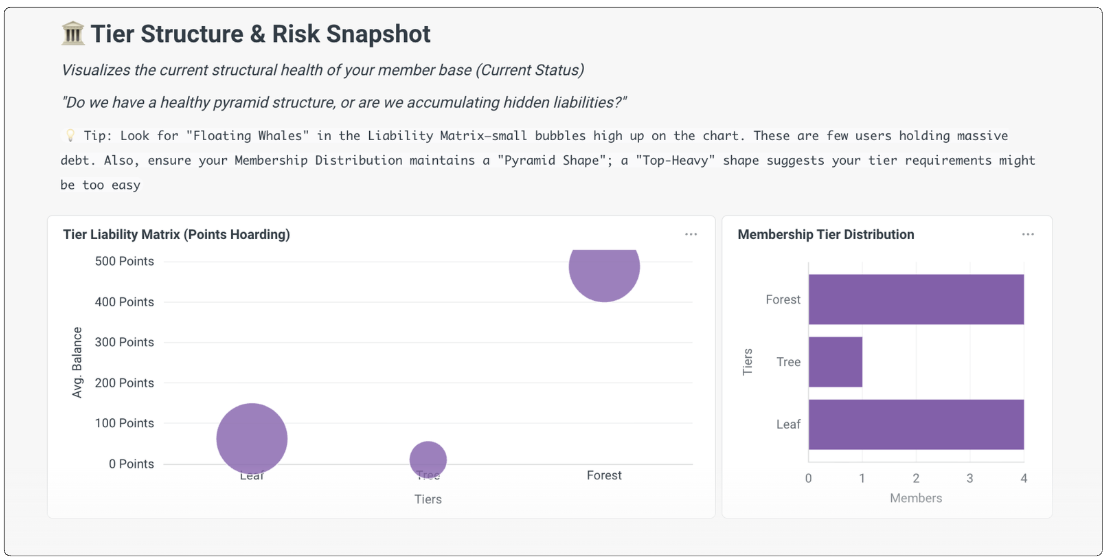
4. Tier Structure & Risk Snapshot
Definition: Visualizes the structural health of your member base and identifies potential financial risks.
Tier Liability Matrix (Points Hoarding):
What to look for: Monitor for "Floating Whales"—small bubbles high up on the Y-axis. These represent a small number of users holding a massive amount of points (debt).
Membership Tier Distribution:
The "Pyramid" Goal: A healthy program should maintain a pyramid shape (more members in entry tiers, fewer in VIP). A "Top-Heavy" distribution suggests that tier requirements may be too easy to achieve, potentially diluting your margins.
5. Tier Economic Contribution
Definition: Analyzes the financial value generated by each tier over a rolling 12-week window.
Revenue Share & Pareto Principle: Use this to validate if your VIP tiers are driving the majority of your revenue (the 80/20 rule).
Tier Performance Table:
The "Staircase Effect": In a well-designed program, metrics like LTV (Lifetime Value) and Purchase Frequency should "step up" significantly as customers move from Leaf to Tree to Forest.
Optimization Tip: If these metrics are flat across tiers, it indicates that your current tier benefits are not successfully changing customer behavior and may need restructuring.